
I wanted to write a little bit about this behavior we just noticed with Unity while it was still very fresh. It’s one of those bugs that are extremely hard to debug, and there’s not really a way to figure it out unless someone else has written about it – so here we go.
- Because of the nature of mobile, we use Sprite Sheets. They allow us to keep build size and memory usage lower (so you think)
- We also re-use objects in sprite sheets fairly frequently. In this case, it was a sprite sheet with about 30 different cards on it that we re-use throughout the project.
We use Resource Checker (a very useful unity plugin) to check scene game objects and sizes of memory objects to make sure we are shipping an optimized game to end users. Today, after a lot of debugging headaches, we found one of the most annoying behaviors of Unity to date. It all started about a week ago, when our app randomly started crashing on the devices of one of our co-founders. It was one of the only devices in our group with 512MB of RAM, so we took this fairly seriously – our game SHOULD be able to run on this.
We started with the basics, digging through logs, profiling, CPU tracing, but no luck. In fact, the memory consumption was stable throughout the entire session, and no trace of any memory increase could be found 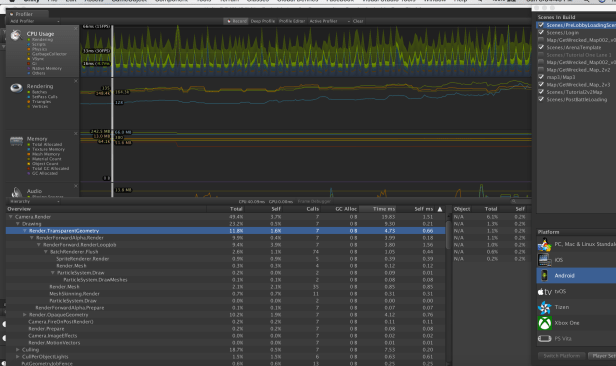
So I kept looking, and looking, until I almost pulled out most of my hairs, and then i saw something in our resource checker:

The sprites in a sprite sheet we used were used 134 times throughout the entire scene (namely on the card overview). You’d assume that it would just instantiate the sprite sheet once and then load from that right? Wrong. Before loading a scene, unity allocates the amount of memory required to load that scene. In the above case, instead of allocating 2MB in memory, Unity allocates 134 * 2MB in memory, because the sprite has 134 instances in the scene, and as a precaution Unity probably loads that amount of memory prior to loading the scene to avoid lag by having to request more memory later.
This issue is invisible in the debugger/profiler because we’re talking about memory allocations here, not usage. This simply means that the app has requested to use that much space, and a crash happens when the OS says “nuh uh, we ain’t got that much space for you to use”. Then you got yourself an out of memory exception.
Anyways – hope this helps other people dealing with the same issue. When you use sprite sheets on objects that have lots of instances, expect larger memory allocations on scene load.
Pim

Hey nice post, save me a lot of time and work, thanks 🙂
No problem! Glad you enjoyed it.